

VLiner Market R1
Basic Volume Analysis Indicator - TradingView
VLiner Market R1 is our debut volume analysis tool designed to provide traders with comprehensive market insights through basic volume analysis - Delta volume. Inspired by the principles of an Order-Flow Trader.
VLiner Market R1 is a TradingView indicator (only available on TradingView).
Published as a protected, closed-source script on TradingView. Free to use, focused on visualization and education.
All MT Blue retail products are available for FREE.
Released:13th December 2025
Details
How It Works
VLiner Market R1 features a unique design approach that combines two powerful analytical components: a Volume Oscillator and Delta Bubbles that tracks 15-minute volume momentum using white/orange color coding, and Delta Bubbles that visualize 30-minute buy/sell pressure with adaptive sizing (1–10 scale).
Special from MT Blue
This special design methodology is rarely implemented by others in the trading community. The indicator plots around Baseline EMA using volume itself to determine the color grading.
Important: VLiner Market R1 is NOT an indicator trading tool. It does NOT provide buy/sell signals or market entry/exit points.
This is a visualization tool that utilizes tick-movement volume and our custom Volume Oscillator plot. Designed specifically for retail traders to enhance their market perspective with visuals.
By using this indicator, you acknowledge that VLiner Market R1 is a visualization aid only and is not intended for algorithmic trading or automated signal generation. It should strictly not be used to make trading or investing decisions.
⚠️ This is NOT an algo trading indicator
Showcase
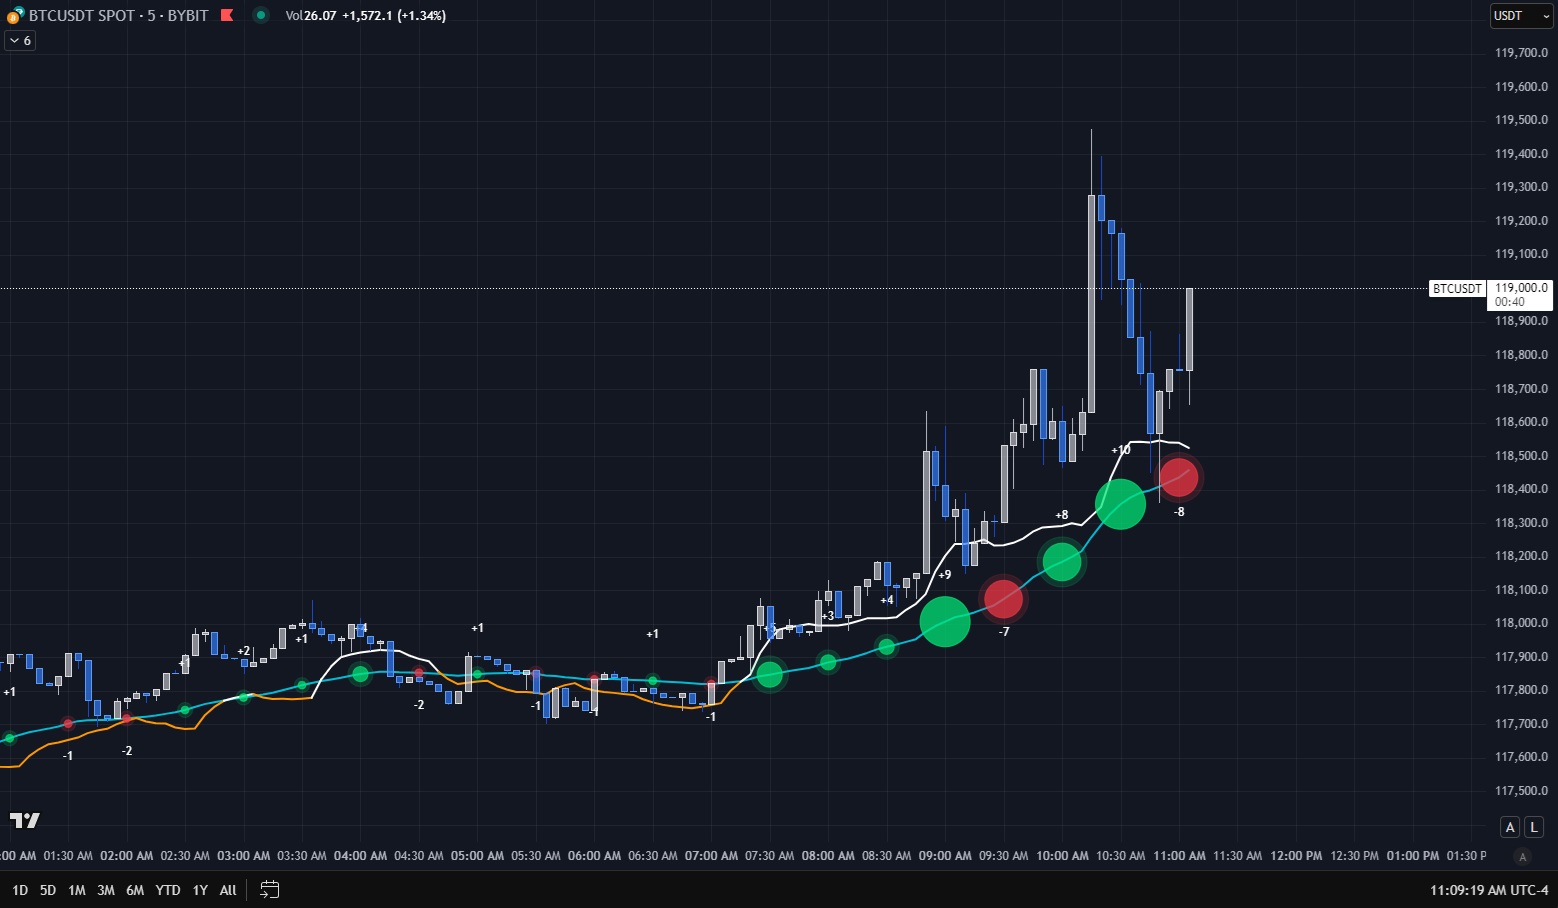
BTC/USDT - Crypto
Real-time volume delta visualization with Delta Bubbles and VO-EMA plotting in action. Notice the dynamic bubble sizing and color-coded volume oscillator response – 5 minute candles.
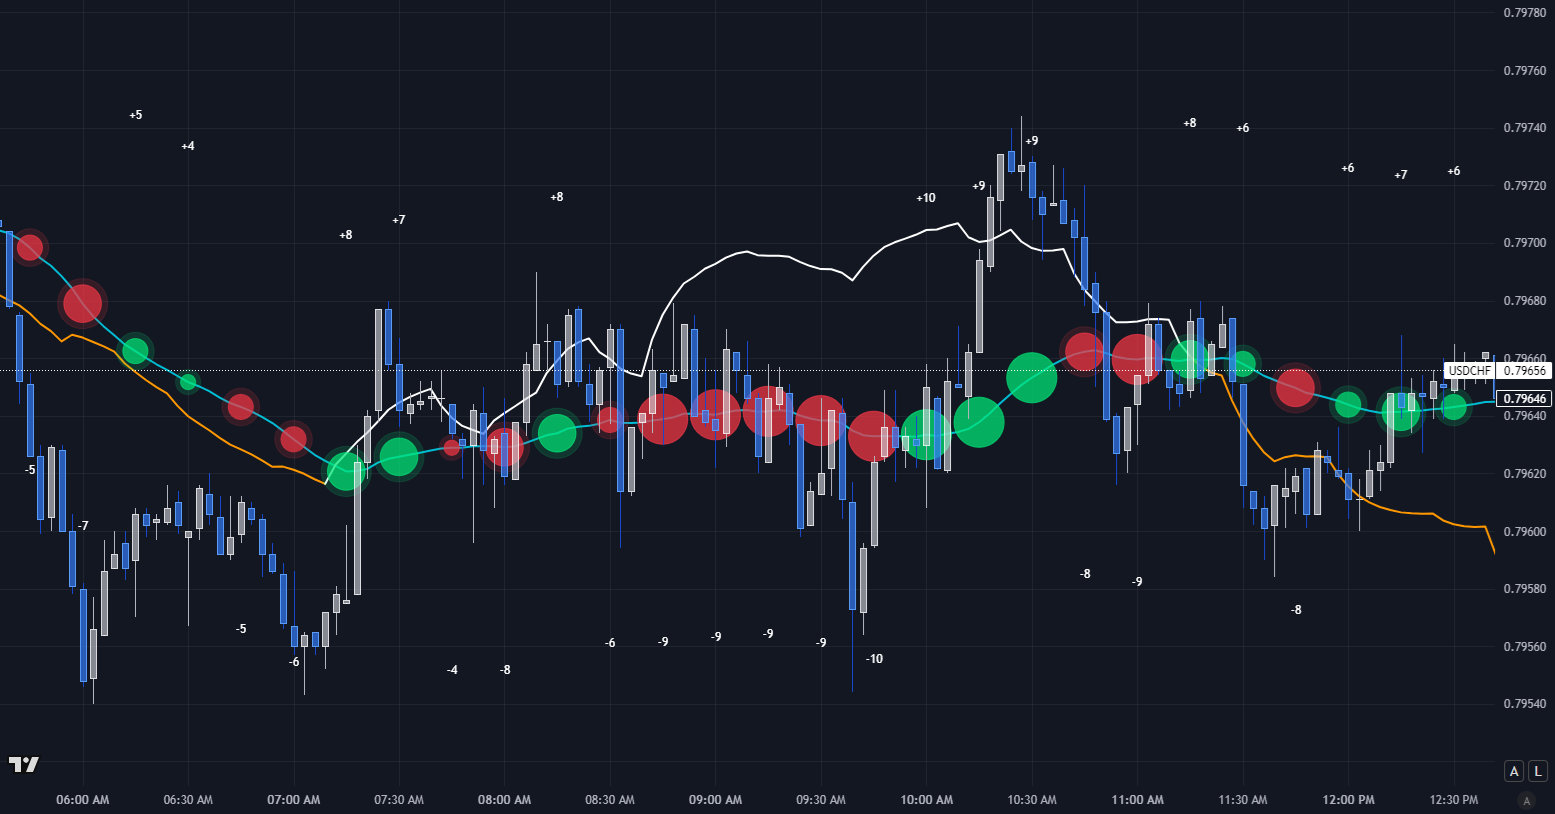
USD/CHF - Forex
USD/CHF forex pair demonstrating VLiner Market R1's effectiveness in the forex market. Showcasing institutional flow detection and volume momentum shifts – 3 minute candles.
⚙️ Settings & Customization
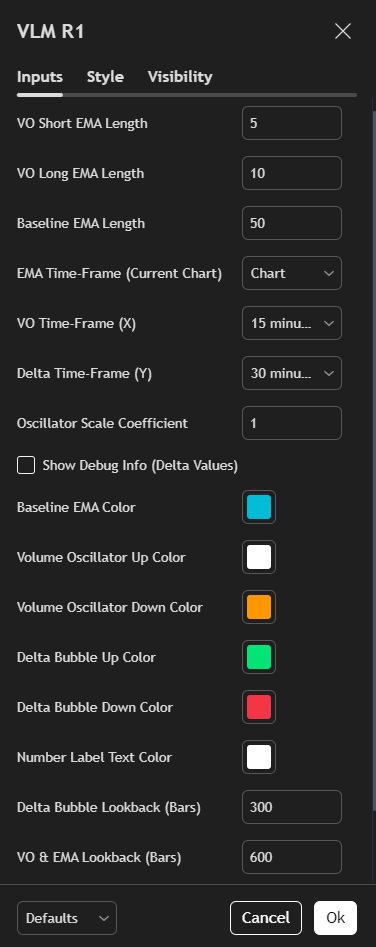
TradingView Customization Panel
Complete control over VLiner Market R1's appearance and behavior directly within TradingView. Customize colors, sensitivity, bubble sizes, and VO-EMA parameters to match your trading style.
✓ Color Schemes
Full RGB control for all elements
✓ Parameter Control
Adjust sensitivity & timeframes
✓ Display Options
Show/hide components as needed
✓ Alert Settings
Custom notification preferences
R1 stands for Retail 1 – where "R" represents our focus on retail traders, and "1" indicates this is the first edition of the VLiner Market series.
This naming convention reflects MT Blue's commitment to creating tools specifically designed for retail traders, with clear versioning to track product evolution and improvements.
Key Features
Volume Delta Analysis
Real-time calculation of buy vs sell volume imbalances using tick movement volume to highlight institutional order flow.
Order Flow Style Visualization
Bubble-based display system showing volume pressure with size-scaled indicators for intuitive order-flow style reading.
EMA-style Trading Crossover
Dynamic baseline EMA system on volume metrics for trend identification and momentum confirmation.
MT Blue's Special – Volume Oscillator
Proprietary volume momentum indicator with look-back based, semi-stochastic oscillation (delta toning) and session-aware calculations.
User Manual & Documentation
Full user manual with setup guides, configuration tips, and explanations of each component in VLiner Market R1.
Technical Specifications
Platform
TradingView (all subscription tiers, published protected script)
Timeframes
1m – 1D (recommended range)
Markets
All markets with volume/tick data (crypto, FX, indices, stocks)
Performance
Optimized for real-time use and TradingView's replay mode
Customization
Full color and parameter control from the TradingView settings panel
Support
Documentation via MT Blue's site and future community resources
Join the Community
Connect with other VLiner users, share ideas, and get support from the MT Blue community as it grows.
Visit Community PageRelease Status
Direct TradingView listing for VLiner Market R1. Protected source script, free to use for visualization and educational purposes.
VLiner Market R1 is live as a protected script on TradingView. Access it directly from this page or via our TradingView profile.